
Visualiser des données météorologiques: représentations des phénomènes atmosphériques
Keywords:
Meteorology, Visual form, Data visualization, Representation, PhenomenologyAbstract
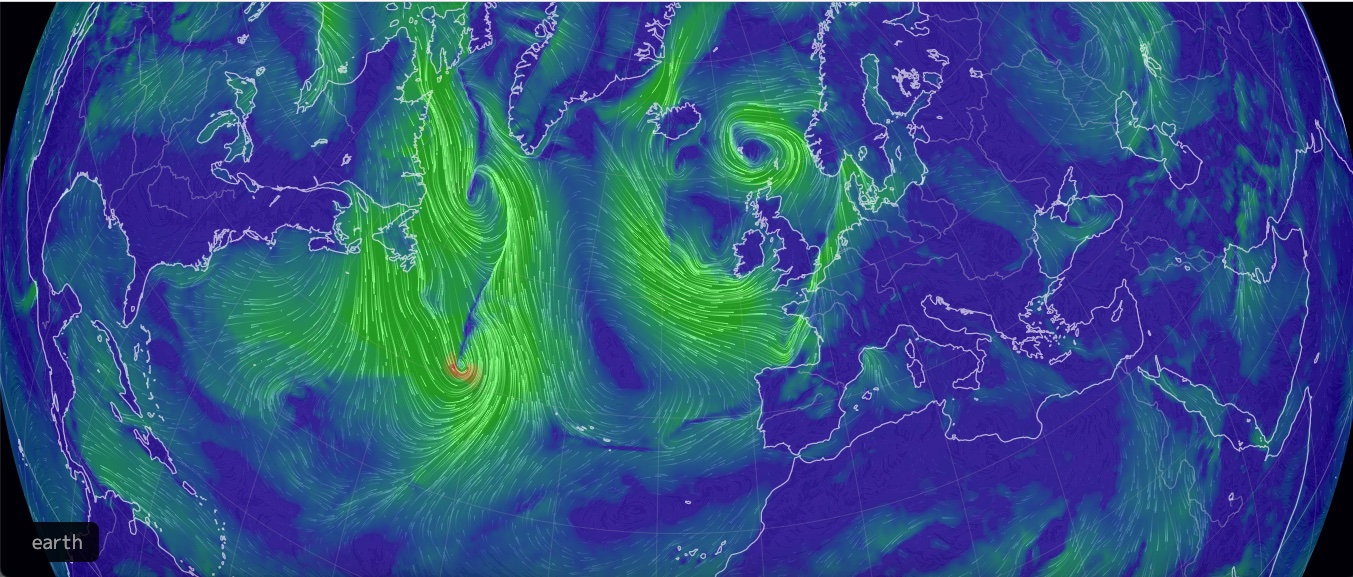
Data visualisation technology has made many databases visible and intelligible, and the issue of accessing, analysing, using and visualising data is one of the problems of the digital society. In this perspective, the representation of weather phenomena raises a series of questions about the visualisation modalities adopted. How are the data of meteorological phenomena represented? From this question, the contribution aims to analyze some 2D representations of meteorology through the tool of data visualization in order to observe the way atmospheric phenomena are rooted in the mediation technology.
Downloads
Published
15-12-2022
How to Cite
Rubessi, C. (2022). Visualiser des données météorologiques: représentations des phénomènes atmosphériques. Elephant & Castle, (28), 49–55. Retrieved from https://elephantandcastle.unibg.it/index.php/eac/article/view/194
Issue
Section
Articoli
License
Copyright (c) 2023 Elephant & Castle

This work is licensed under a Creative Commons Attribution 4.0 International License.